1.6 KiB
1.6 KiB
Tarangam
It is a simple application to see log from serialports and plot on graph.
Rules of text to Draw on graph
- Each line in the text should start with #
- you can write as foo=value or just values with space
Example
#s=1 b=2
#1 5 4
Interface
Top Most ToolBar
- Button with refresh icon is to reload list of ports.
- Select Port
- Select Baudrate
- Start
- Stop
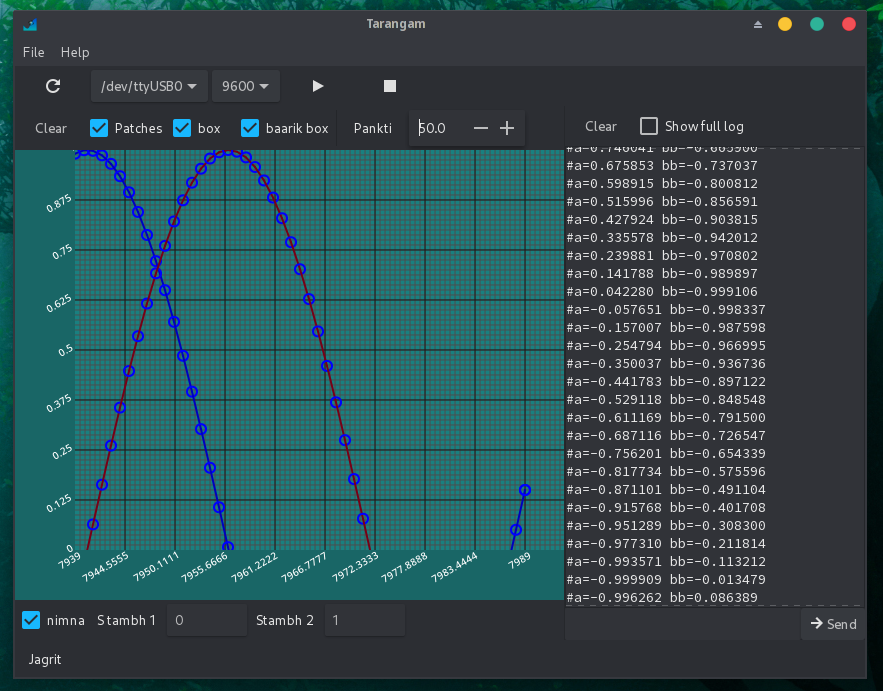
Second ToolBar (left panel)
- Clear Graph
- Show small circles over the points where values lies
- Show larger boxes
- Baarik Box, show small boxes which make it look like graph paper
- Pankti is number of values to show in y axis
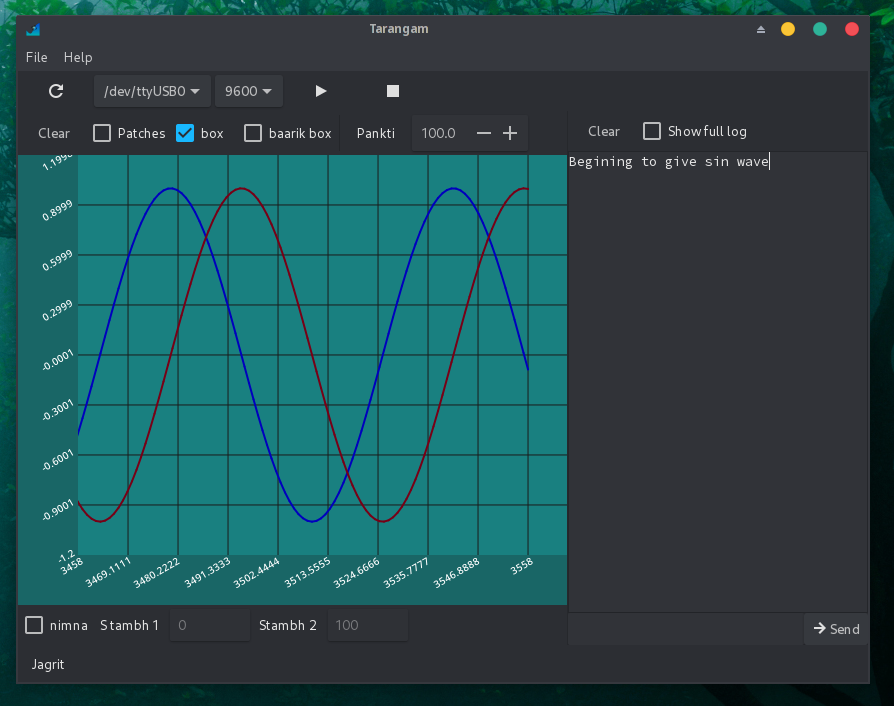
Second ToolBar (left panel)
- Clear Log
- Show full log which include points to draw on graph
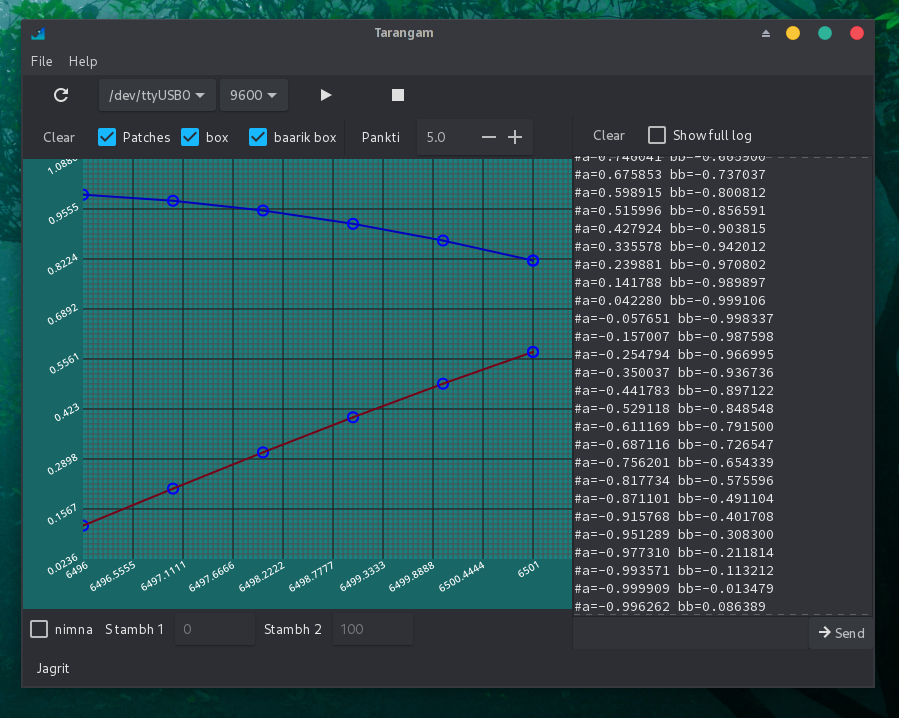
Bottom ToolBar (left panel)
- Nimna is to use custom value of y axis
- Stambh1 is lower point on y
- Stambh2 is higher point on y
Bottom ToolBar (left panel)
- Send Text
LICENSE
This program is free software: you can redistribute it and/or modify it under the terms of the GNU General Public License as published by the Free Software Foundation, either version 3 of the License, or at your option) any later version.
This program is distributed in the hope that it will be useful, but WITHOUT ANY WARRANTY; without even the implied warranty of MERCHANTABILITY or FITNESS FOR A PARTICULAR PURPOSE. See the GNU General Public License for more details.
You should have received a copy of the GNU General Public License along with this program. If not, see https://www.gnu.org/licenses/.